About Me

My photo
I am a young invester/Trader, i mostly focus on Short term or Intra day trading on the equities or Forex markets. I have recently completed my Bachelor of Commerce double major in Finance and Property. I have also completed my RG146 in securities and Financial planning and while trading is a passion my desire is to work within the stockbroking industry or as a trader for an investment bank. This blog I have set up to help share ideas to others on trades and tips i have picked up from my time in the market. I hope you enjoy my blog and some of my ideas :)

Twitter / scilliams

This blog i have designed for a bit of fun, education and sharing of my thoughts in regards to trading the ASX or general equities trading and also FOREX trading. I am no expert and nothing on this blog should be taken as financial advice, it is merely just a tool for myself to share any trading thoughts i have and for people to enjoy reading :)

Sunday, July 25, 2010

QBE

Some more analysis on QBE.

I actually sold out all of the position i bought before which i know i know naughty boy but a range is a range. Ok but i am looking at taking a Position trade on QBE now after reviewing a few charts as seen below to hang on into the dividend which is around 60 odd cents or around 3.5% if my maths serves me correctly...

Below is a chart of the dividend and what caught my attention was the similar pattern to the august 2006 lows then runs up into dividend. Generally stocks will run up into the dividend and QBE has a nice dividend so could be worth while...

QBE Dividends

Next charts are a few gann charts i quickly scraped together for a bit more of an argument as to why i think it will go up...

the first one shows the 50% resistance of the all time highs as well as the 50% of the last major range up both falling at $17.74 and $17.35 respectively

qbe time price

This run up lasted 2190 days and if we consider this move took this long to do 100% and is now at the 50% mark after 50% in time it could be ready for a run up? Ideally you would want the 18th of September to be a low at the 50% of the rise resistance level as that is a very strong argument for a reversal However i am wanting it to run UP into the dividend so happy to take this higher low for a position trade here as risk is small to potential reward...

qbe all time lows

The last chart is the all time low's squared out and displaying the 50% level (green line) of these moves which also falls on the $17.50 area and shows why it is such an important level.

And this last one is just an indicator chart i think i posted. i did another but couldn't be bothered uploading it but basically just showing how over sold it is on the weekly and what has happened all the last times that she was in a similar position...

QBE Weekly

SORRY for not updating regularly but i will try post more...promise :)

Hopefully this makes up for it and makes us some dollars in the process :)

Wednesday, July 14, 2010

Charts

I have taken 2 position trades for longer term moves on both LGL, NCM and QBE.

I am bearish on gold hence the shorts, i am anticipating a lower swing top to be formed on both of these charts. i have only taken P1 here and will add on a confirmation.

I have the LGL chart here forming a double top and then lower top also. today was a turn date on LGL so took P1 today and with NCM. Stops are above the highs which can be moved when move begins.

LGL weekly

QBE i took a part postion today anticipating a break of that $18 resistance and then a move up to $20.

Will trade the swings on this one based on weekly time frame. So many things line up that let me know that this could be a good trade. For tighter stops place stops below 17.50

QBE Weekly

Sunday, July 11, 2010

Market Wrap

I have not had to much time this weekend that i spent on the market.

Personally i am thinking we might see a rally continued on monday and maybe sell off? Im thinking market might come down until the 19th might a higher swing low then rally? I would love to see a nice higher swing into this date espicially 50% of this last move.

I will try get a chart or 2 up this week sorry i have been flat out with some other things, and again this week im going to be watching FX markets with a bit more intention.

Anyway ill try post otherwise all be on twitter :)

Monday, July 5, 2010

Repeating WPL

woodside (WPL)

Just something interesting that i noticed when doing a chart for a friend. The range from 2006 down has completed if it was to have repeated. Back in 2006 $35 was the support and held and now $40 seems to be the support which if it holds dare i suggest that we get the move that repeated after the last pattern?!?

Just something interesting i noticed without going into to much detail...

Photobucket

Sunday, July 4, 2010

Monday...Sub 0

Literally going to be 0 degrees here tomorrow...
Not 100% sure i will be able to pull my sick ass out of bed tomorrow and sit here freezing watching our boring market go nowhere until the US gives us a lead...

Still if we have some weakness i might look to get a few longs, I will update the twitter with those as they come. Might give it some time and see if i cant work out some nice 'weekly' range entries.

Anyway lots of talk of turns this month with the first one being the 8th of July... Guess gotta wait and see now.

See ya'll this week :)

Saturday, July 3, 2010

July Market Analysis

Well i am finished up with my FX classes so spent a big chunk of my Saturday doing some serious market analysis so here it what i have produced using a few various methods and what i am generally seeing...

For the month of July we are assuming that we could form a bottom around the middle of July, Especially looking at the dates of the 10 – 14th of July or the 16th/19th of July. I am expecting this month to be a doji looking candle on the index with maybe a short rally at the start of this week (5th of July)

Photobucket

The IG cash range for the monthly chart is currently 798 with a weekly range of 408. Basically what I can take from this is that for the month if we are down and have already made a top for the month of July we will be taken down around 9212 (75%) of the monthly range. I however doubt that a top has been put in for the month of July and think a real assessment of a down side target will be better done after this coming week (or after a convincing rally) At present the Daily indicators are in the oversold position.

Another interesting thing to point out with the DOW is that of the entire move up from march we have yet to make a fib of this rise. I would be expecting a 50% which is around 8900 or a 38.2% which is around 9400... 9400 is covered over next few paragraphs.
Friday’s candle did break the highs on the IG cash (NFP Volatility) but the DJIA chart has yet to break a high yet to confirm that the trend could possibly change to the upside. Any longs from here are purely bottom picking and for the low risk traders among us it is not recommended. I however am expecting a rally hopefully from Tuesday when the US markets open again from their July 4th Long weekend.


I am expecting a retest of the key 10,000 level and have actually worked out my monthly ranges from here as well which actually takes us down to the support levels of 9400 And this is where I expect that the mid July lows could be confirmed and a real relief rally could emerge from. Should the market not have the strength to retest this level or reclaim it then I would expect much more downside to emerge as the market continues its trend down. 9000 Should also prove to be a key support level but we will cross that bridge should it come closer.

Should all this fail and we retest 10,000 and we play out based on the head and shoulders pattern that has emerged we could see the market fall down to levels around 8800...

Photobucket

XJO
For the Australian market I have been updating my day and point count chart for some time. Basically it took us 31days to rally 397 points and only 11 days to evaporate 408 pts and all the gains the rally gave us.

Photobucket


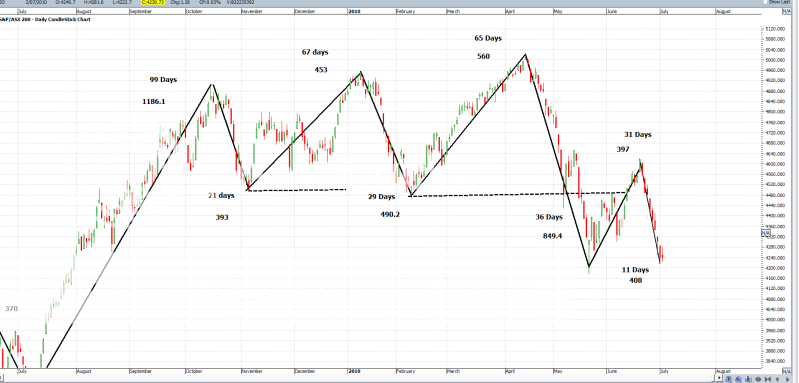
That rally reached just over the 4600 50% fib of the drop level and reversed Should we take a fib extension on this number using a 150% fib of the move (as retraced 50% so extend to 150%) this takes us down to 3750 another key support level. If I extend the first range down this also puts us roughly around the Middle of July Turn date. I have also included the 138.2% fib which is the 3850 level. I Also would watch 4000 as this level should prove to be a tough level to break and should be around here coming into the turn date or at (4122 on the SPI into turn date) I would look to take P1 here and P2 on the first higher swing bottom made in the market and add P3 once this position has been confirmed.

Photobucket

Moving closer to the IG index and on more of a short term time frame I would be expecting some sort of rally this week and likely a retest of the 21EMA which has been containing price. The index simple MA’s have given the death cross and certainly does not weigh to strongly for the case of the bulls. However a small rally should be expected soon.

Again the weekly range for IG XJO cash is 205 and this could take us down to around that 4000 support should we run down from where we are. However I think we might have a difficult ‘choppy’ week while the light volumes in the US give little direction and the market works out what way it wants to go.

Thursday, July 1, 2010

WBC 'tea leaves'

I 'dipped a toe' in long today on WBC,

Gann all time low price squares to show support and resistance levels on price, has completed 100% of weekly range and the daily looks like could have a bounce tomorrow espicailly being friday and NFP so could be a short covering rally. Will try off load into the 100% of daily range and if looking strong will hold for $22...

Photobucket

NeoCounter